


A/B testing is the key to making data-driven decisions for businesses earning $1M–$20M annually. But scaling it effectively is challenging. The reality? Only 10–30% of tests produce clear winners, and 72% of marketers feel their strategies fall short. This guide covers how to overcome common barriers like manual processes, poor organization, and limited resources.
Key Takeaways:
- Focus on impactful tests tied to business goals, not just running more experiments.
- Use clear KPIs: Primary (e.g., conversions), Secondary (e.g., clicks), and Guardrail metrics (e.g., load times).
- Build structured workflows and centralize test tracking to avoid redundancies.
- Automate processes with tools like Statsig, Optimizely, or LaunchDarkly to save time and boost efficiency.
- Adopt statistical best practices: 95% confidence levels, proper sample sizes, and avoiding premature data analysis.
- Organize teams with roles like Experimentation Lead, Data Scientist, and Developer, scaling based on company size.
90-Day Plan:
- Days 1–30: Set clear goals, validate tracking, and start with small, high-impact tests.
- Days 31–60: Create centralized systems, automate reporting, and expand testing across funnels.
- Days 61–90: Increase testing speed with reusable templates, AI tools, and a hybrid team model.
Scaling A/B testing isn’t about running endless experiments – it’s about creating a system that drives measurable growth while maintaining quality and efficiency.
90-Day A/B Testing Scale-Up Plan for Growth-Stage Businesses
A/B Testing at scale: Building an A/B testing culture from the ground up – EvolveDigital NYC 2025
Setting Up Your A/B Testing Foundation
Building a strong foundation for A/B testing – one that includes clear goals, structured workflows, and a data-driven mindset – is essential for driving meaningful business results. The aim isn’t to run as many tests as possible; it’s to focus on tests that bring real value. Here’s how to set up metrics, workflows, and a testing culture that can scale successfully.
Setting Clear Goals and KPIs
Every test needs a well-defined success metric to stay focused and avoid cherry-picking results. To do this, organize your metrics into three categories:
- Primary KPIs: These measure direct business outcomes, like checkout conversions or subscription rates.
- Secondary Metrics: These track user behavior signals, such as add-to-cart clicks or newsletter signups.
- Guardrail Metrics: These ensure the user experience remains intact, monitoring factors like page load times, error rates, or unsubscribe rates.
To evaluate your experimentation program as a whole, track metrics like Experimentation Frequency (how many tests you run monthly), Win Rate (the percentage of tests that outperform the control), and Learning Rate (how quickly you gain insights about your users). Keep in mind, industry averages show only about 33% of tests succeed. By connecting each experiment to your North Star metric – the single number that reflects your business’s growth – you ensure your testing efforts contribute to long-term success.
Set statistical benchmarks, like a 95% confidence level and a minimum 3% practical significance, to ensure your results are reliable. Plan for a test duration of 7–14 days to capture enough user behavior data for meaningful insights.
Creating an Experimentation Workflow
Once your goals are clear, the next step is establishing a structured workflow. This helps transform one-off tests into a repeatable system. Start by gathering test ideas from various sources: customer feedback, analytics, competitive research, and team brainstorming. Use frameworks like ICE (Impact, Confidence, Ease) or PIE (Potential, Importance, Ease) to prioritize these ideas objectively.
In March 2025, Peloton‘s Growth Analytics team, led by Mohit Singh, shifted from an ad-hoc testing approach to a systematic process. They introduced a centralized A/B Test Repository and standardized templates for experiments. This change reduced analysis time by 40% and increased their win rates from 40% to 75%. Mohit Singh explained:
"Scaling experimentation isn’t about running more tests. It’s about making learning systematic – and sanity sustainable".
To prevent overlapping experiments, maintain a centralized test calendar. Use pre-test checklists to outline your hypothesis, key metrics, guardrails, and expected outcomes. Automate reporting with dashboards that display real-time results, letting your team focus on strategic analysis instead of manual data collection.
Creating a Testing Culture
To scale A/B testing effectively, decision-making needs to shift from opinions to data. When disagreements arise, the default response should be: "Let’s test it." This approach eliminates lengthy debates and keeps the focus on results.
Failures are inevitable, but they’re also valuable learning opportunities. Document why a test failed and share these lessons during regular review meetings. In these sessions, present the hypothesis and variations without revealing the results upfront. Ask team members to predict the outcome before revealing the data – this encourages engagement and helps uncover biases.
Make past test results easy to access to avoid duplicate experiments and help teams build on previous findings. When Peloton implemented a centralized repository, they reduced last-minute data requests by 60%, as teams could independently access insights from earlier tests. This system turns your testing program into a growing resource rather than a collection of disconnected efforts.
Organizing Your Team and Resources for Scale
Scaling A/B testing takes more than tools – it requires the right team structure and resource allocation. The difference between a testing program that struggles to gain traction and one that drives meaningful growth often lies in how effectively you organize your people and processes.
Key Roles
A strong A/B testing program depends on eight key roles, though you don’t need to fill all of them right away. Start with the most critical positions and expand as your program grows and proves its value.
- Experimentation Lead: This person oversees strategy, manages the testing roadmap, and ensures alignment with business goals. They also share insights across teams to maximize learning.
- CRO Lead: Focused on execution, they develop hypotheses, manage test implementation, and document outcomes. They often collaborate closely with a Data Scientist or Analyst, who ensures statistical accuracy, calculates sample sizes, and builds measurement frameworks.
- Software Developer: Implements test variations and ensures smooth technical execution.
- Designer: Maintains design consistency across test variations.
- Marketing Manager: Brings a deep understanding of the customer journey to the table.
- Product Manager: Aligns tests with the product roadmap and broader business goals.
- User Researcher: Provides qualitative insights to complement quantitative data.
When building your team, focus on core skills like statistical analysis, digital analytics, front-end development (HTML, CSS, JavaScript), and project management. These capabilities lay the foundation for a scalable and effective testing program.
Budget and Team Size by Company Stage
Your resource needs will vary depending on your company’s stage of growth. Most organizations progress through four stages of testing maturity – Crawl, Walk, Run, and Fly:
- Walk Stage (Small Growth-Stage Businesses): At this stage, you might run 1–4 tests per month. Team members often wear multiple hats, combining roles like CRO Lead and Data Analyst. Testing tools are typically basic, relying on manual A/B testing and simple event tracking.
- Run Stage (Medium-Sized Companies): With 5–100 tests per month, you’ll need to invest in a dedicated experimentation platform. This stage often requires at least one full-time data analyst and a developer who can dedicate 20–30% of their time to testing.
- Fly Stage (Larger Growth-Stage Businesses): Running 100–10,000+ tests monthly becomes the norm. Testing is integrated into every feature launch, requiring automated rollouts, AI-driven tools, and a fully staffed team covering all core roles.
One key metric to keep in mind: aim for 1–10 tests per engineer annually. Running more than 30 tests per engineer can dilute impact, reducing effectiveness by up to 87%. Quality always trumps quantity when it comes to testing.
Centralized vs. Distributed Testing Teams
How you structure your testing team can significantly affect both speed and quality. There are three common models: centralized, distributed, and hybrid.
- Centralized Model: In this setup, all testing expertise is housed within a single team. This ensures consistent methodologies, high statistical standards, and efficient resource use. However, as the program grows, a centralized team can become a bottleneck, slowing down execution when multiple teams need support.
- Distributed Model: Here, testing is embedded within product or marketing teams, allowing for faster execution and closer alignment with team-specific goals. However, this approach risks inconsistent quality and duplicate efforts.
- Hybrid Model: Many companies find success with a hybrid approach. They start with a centralized team to establish strong foundations – standardized methodologies, training, and documentation – and then gradually decentralize execution. The central team remains as advisors, providing oversight and maintaining statistical rigor while enabling faster, team-driven testing.
For growth-stage companies looking to scale their testing programs, a hybrid model offers the best of both worlds: speed and flexibility combined with consistent quality.
If you’re looking for expert guidance on structuring your team for success, Graystone Consulting (https://graystonellc.net) specializes in building scalable marketing operating systems tailored to your business needs.
Using Tools and Automation to Increase Testing Speed
When it comes to scaling your testing efforts, the right tools and automation can make all the difference. By streamlining processes and eliminating manual bottlenecks, you can go from running a handful of tests each quarter to managing hundreds simultaneously – all while maintaining accuracy and statistical rigor. Let’s break down the essential tools and strategies that make this possible.
Core Tools for Scaled Testing
A successful testing stack relies on four key categories of tools:
- Experimentation Platforms: Tools like Statsig, Optimizely, and VWO are designed to run experiments while ensuring statistical rigor. They provide the foundation for reliable testing at scale.
- Feature Flagging Systems: Solutions such as LaunchDarkly and Split enable progressive rollouts and instant rollbacks, giving you greater control over feature deployment.
- Analytics Platforms: Tools like Amplitude and Mixpanel help track user behavior and measure key performance metrics, ensuring you have actionable insights.
- Warehouse-Native Solutions: These integrate directly with systems like Snowflake, BigQuery, or Databricks, consolidating all your data into a single source of truth.
Warehouse-native testing has transformed how teams manage experiments. For example, Notion scaled from just a few experiments per quarter to over 300 running concurrently by adopting Statsig’s warehouse-native infrastructure and usage-based pricing model. This approach eliminates the hassle of data silos, allowing teams to track critical business metrics – like revenue, retention, and customer lifetime value – without needing to transfer data between systems.
"Statsig’s infrastructure and experimentation workflows have been crucial in helping us scale to hundreds of experiments across hundreds of millions of users." – Paul Ellwood, Data Engineering, OpenAI
Automating Your Testing Workflow
Once your tools and workflows are in place, automation can supercharge your testing program. By automating key processes, teams can reduce analysis time by up to 40% while also improving accuracy. Modern platforms now use AI to generate insights, predict how long tests will take, and even produce development-ready code. Techniques like CUPED (Controlled-experiment Using Pre-Experiment Data) further enhance efficiency, cutting experiment runtime by 30–50% by using pre-test data to lower variance.
A great example of automation in action is 7-Eleven. In May 2022, the company automated its A/B testing reporting across 70,000 locations in 17 countries. This reduced reporting time from 100 hours to just 1 hour, boosting overall efficiency by 60%. Similarly, Cox Automotive improved its experimentation program’s health score by 27% in a single quarter after adopting automated warehouse-native analytics.
Automation also plays a vital role in monitoring experiments. Guardrail metrics – such as page load times, error rates, and other key business indicators – can be automated to track performance in real time. If an experiment starts negatively impacting the user experience, the system can immediately halt it, safeguarding your business while allowing for more aggressive testing strategies.
Connecting Tools to Your Marketing System
Integration is the next step in ensuring that your testing efforts directly impact your business outcomes. Your testing platform should seamlessly connect with your CRM, analytics systems, and data warehouse to provide a unified view of customer behavior. This connectivity allows you to measure long-term outcomes, like customer lifetime value and churn, rather than focusing solely on short-term metrics like clicks or conversions.
For instance, Brooks Running achieved an 80% decrease in product return rates by integrating personalized sizing recommendations with its core business data through an experimentation platform. This kind of integration ensures that your testing program delivers measurable, real-world results.
For growing businesses, there are cost-effective options to get started. Statsig offers a free tier for up to 2 million events per month, while Amplitude provides a free starter plan for up to 50,000 monthly tracked users [22, 24]. Look for platforms that cater to both technical teams (with robust SDKs) and non-technical users (with visual editors). This balance prevents bottlenecks and ensures smooth scaling.
If you’re looking to build a connected marketing infrastructure that ties testing into your broader growth strategy, Graystone Consulting specializes in creating scalable marketing operating systems tailored for growth-stage businesses. You can learn more at Graystone Consulting.
sbb-itb-ad881f4
Maintaining Quality and Statistical Accuracy at Scale
With clear goals and automated workflows in place, quality controls are critical for scaling A/B testing without sacrificing accuracy. Here’s why it matters: 68% of audited A/B experiments fail due to insufficient sample sizes, leading to unreliable results. To avoid such pitfalls, it’s essential to integrate quality controls right from the start.
Statistical Basics for A/B Testing
To ensure your test results are reliable, focus on mastering four key statistical principles:
- Statistical power: Typically set at 80%, this helps reduce Type II errors – false negatives where you might miss a real improvement because your sample size is too small.
- Significance level (alpha): Commonly set at 0.05, this controls Type I errors, which occur when you mistakenly believe a change worked when it didn’t.
- Minimum Detectable Effect (MDE): This defines the smallest measurable change worth detecting. Smaller effects require much larger sample sizes to confirm with confidence.
- Sample size calculation: Always calculate your required sample size before launching a test. Checking for significance after starting can skew results.
Microsoft research highlights that true interactions between simultaneous tests are rare, meaning you can often run multiple experiments in parallel without compromising data quality. Additionally, A/A testing – comparing identical versions – can help verify that your platform is randomizing users correctly before you scale up. These foundational practices set the stage for rigorous, data-driven testing.
Avoiding Common Testing Mistakes
One of the biggest pitfalls in A/B testing is reviewing data too early. Premature analysis leads to inflated false positive rates. To address this, consider using techniques like the mixture Sequential Probability Ratio Test (mSPRT), which adjusts significance thresholds as data accumulates.
A great example of avoiding such mistakes comes from Tre Kronor Media, which in 2025 achieved a 73% increase in click-through rate by leveraging AI-powered predictive analysis. By identifying weak headlines and visuals before deployment, they preemptively cut the bottom 50% of creative concepts, reducing false negatives and focusing on high-performing variants. Similarly, CO-RO, a beverage brand, saw a 20% boost in brand awareness by using AI to optimize visuals, testing only the top 3 to 5 variants with live audiences instead of spreading resources thin.
Building Quality Control Processes
Once you’ve grasped the statistical essentials and common pitfalls, it’s time to formalize quality control processes. Start with the PICOT Framework (Population, Intervention, Control, Outcome, and Time horizon) and a three-tier metric system:
- Primary KPIs: Metrics like revenue and conversions that directly impact business goals.
- Secondary Metrics: Indicators of user intent, such as click-through rates or engagement.
- Guardrail Metrics: Factors like page load times and error rates that ensure overall system health.
To streamline workflows and maintain alignment, adopt a RACI governance model:
- Responsible: Development leads
- Accountable: Program managers
- Consulted: SEO and brand leads
- Informed: Stakeholders.
Standardized component libraries with locked templates can also help reduce manual errors and maintain brand consistency across large-scale tests. Additionally, introduce "Knowledge Huddles" – quick, weekly 30-minute sessions where teams share insights and document findings in an experiment registry. This prevents repeating failed ideas and accelerates overall team learning.
"Data without context is noise. Insights without action are souvenirs." – MondaySys
Finally, enforce strict statistical and performance thresholds as part of your release process. Set a minimum statistical confidence level of 95% and a practical significance (MDE) of at least 3% to ensure that "winning" variations are genuinely impactful. These measures help you make data-driven decisions with confidence.
90-Day Plan for Scaling Your A/B Testing Program
Scaling an A/B testing program takes time, effort, and a clear roadmap. A structured 90-day plan allows you to build a solid foundation, implement effective systems, and boost testing speed – all without compromising quality. Here’s how you can approach it in three clear phases.
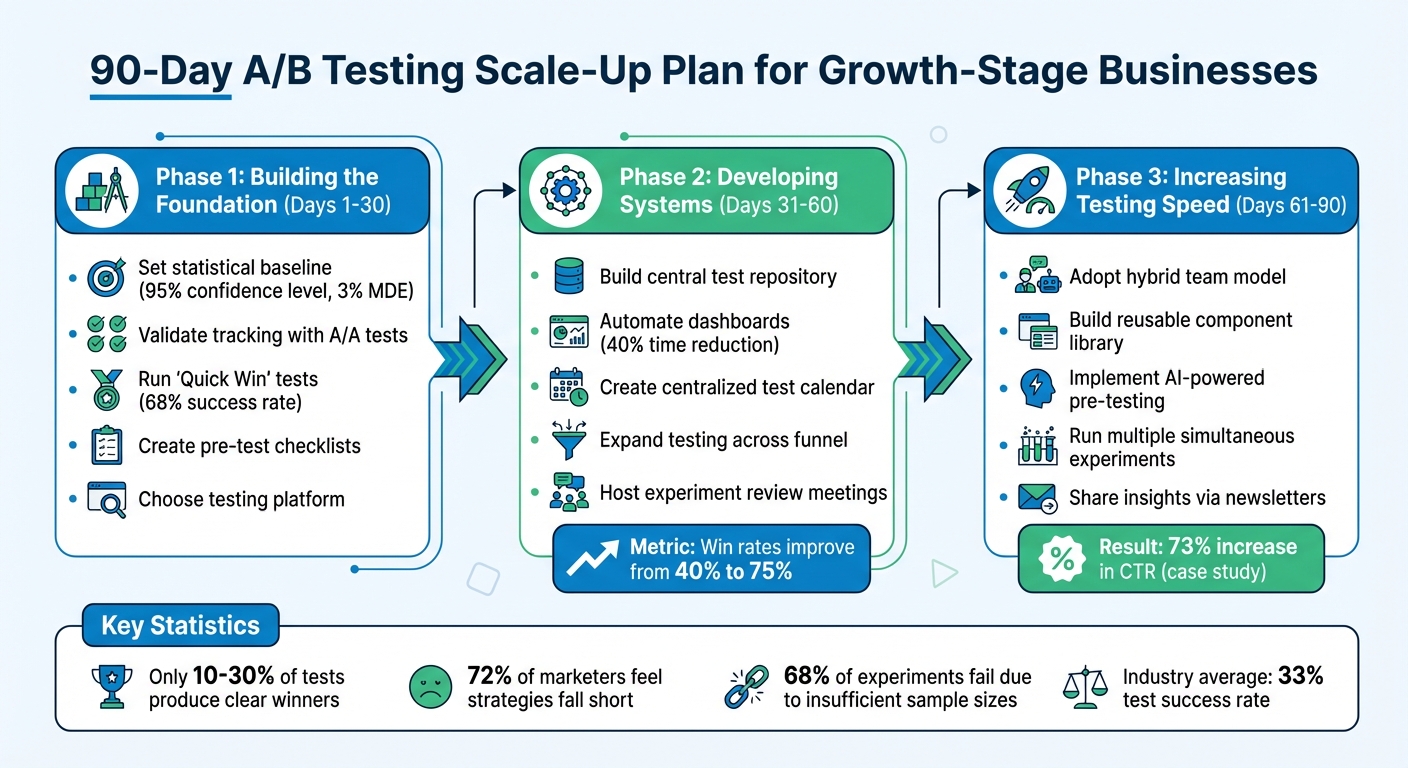
Phase 1: Building the Foundation (Days 1–30)
Start by assessing where you are versus where you want to be. Set a statistical baseline with clear rules for handling outliers, novelty effects, and defining success windows. Choose a testing platform that keeps incremental costs low and focus on high-impact elements like headlines, value propositions, and CTAs.
Use the ICE framework (Impact, Confidence, Ease) to prioritize ideas based on their potential value rather than intuition. This ensures you’re focusing on changes that matter most.
Create a pre-test checklist that includes your hypothesis, primary and guardrail metrics, and required sample size. Before diving into high-stakes tests, validate your tracking and randomization setup with A/A tests (using identical variants). Start small with "Quick Win" tests – low-effort changes with high potential impact – to build confidence and momentum.
| Stream Type | Risk Level | Typical Success Rate | Purpose |
|---|---|---|---|
| Quick Wins | Low | 68% | Immediate gains, low effort |
| Strategic Plays | Medium | 42% | Funnel optimization |
| Moonshots | High | 15% | Long-term innovation |
Once you’ve completed foundational tests, begin setting up systems to scale these learnings.
Phase 2: Developing Systems (Days 31–60)
With your foundation in place, shift focus to creating scalable systems. Start by enhancing your central test repository to track improvements and prevent redundant tests. Organizations that systematically document and share insights can improve experiment win rates from about 40% to 75%.
Automate dashboards to cut down manual analysis time by 40% and streamline workflows. A centralized A/B test calendar is another must-have, helping cross-functional teams (e.g., Marketing, Product, Engineering) avoid overlapping experiments that could skew results. Expand your testing efforts across the entire funnel, beyond just landing pages or checkout flows.
Host regular experiment review meetings, where teams predict test outcomes before results are revealed. This encourages intellectual humility and normalizes failure as part of the process. Document every test – wins and losses alike – in a searchable log to ensure insights are accessible across the organization.
Phase 3: Increasing Testing Speed (Days 61–90)
With systems in place, the next step is to ramp up testing speed. Adopt a hybrid model where centralized teams maintain quality control, and decentralized teams increase the frequency of experiments.
Build a reusable component library featuring proven headlines, CTAs, and layouts. Incorporate AI-powered pre-testing tools to speed up variation setup and identify underperforming ideas before they go live. For example, in early 2024, Tre Kronor Media used Neurons‘ AI-powered pre-testing to refine display ad variations. By making targeted adjustments in just 30 minutes, the agency boosted click-through rates by 73%.
Track key metrics like testing velocity and win rates. Share results regularly through monthly newsletters or weekly knowledge-sharing sessions to turn individual insights into collective wisdom. By the end of this phase, you’ll have the tools, processes, and coordination needed to run multiple experiments simultaneously while maintaining data integrity.
"Scaling experimentation isn’t about running more tests. It’s about making learning systematic – and sanity sustainable." – Mohit Singh, Product Analytics Leader, Peloton
Core Principles for Long-Term Testing Success
Once you’ve completed your 90-day ramp-up, the real challenge begins: maintaining momentum while ensuring your data stays accurate and meaningful. Long-term A/B testing success isn’t about running endless experiments – it’s about creating systems that turn individual test results into collective insights. By building on earlier strategies, this framework ensures your testing program continues to drive measurable business results.
Connect Testing to Business Outcomes
Every experiment should directly support a critical business metric, such as customer lifetime value (LTV) or subscription renewals. To stay focused, use a three-tier metric system:
- Primary KPIs: Measure revenue-related outcomes.
- Secondary Metrics: Track behavioral signals like add-to-cart rates.
- Guardrail Metrics: Monitor user experience factors, such as page load times or error rates.
For each test, calculate its 12-month impact by considering reach, expected lift, and annual revenue potential. This “impact sizing” helps teams avoid wasting time on superficial changes, like minor UI tweaks. Research from over 127,000 experiments highlights that three of the five most commonly used metrics – such as click-through rates on CTAs – have minimal influence on actual business outcomes. Focus on metrics that truly matter, not just the ones that are easiest to track. This principle aligns with earlier discussions on prioritizing key KPIs and guardrails.
Document and Share Learnings
To make the most of your testing program, turn individual experiments into shared knowledge. A centralized, searchable test repository combined with regular review sessions can transform even failed tests into valuable insights.
Use standardized templates for documenting experiments. Each template should include the hypothesis, primary metric, guardrails, sample size, and a post-mortem analysis explaining the results. Regular review meetings are equally important – ask team members to predict outcomes before revealing the results. This practice fosters intellectual humility and encourages deeper engagement with the data. Keep in mind, failed tests are just as valuable as successful ones because they challenge incorrect assumptions about user behavior.
Scale Testing Responsibly
Running more tests doesn’t automatically lead to better results. Prioritize quality over quantity. Frameworks like PIE (Potential, Importance, Ease) or ICE (Impact, Confidence, Ease) can help you focus on high-impact opportunities rather than minor adjustments.
Guardrail metrics are essential for protecting long-term performance. Tests should run for at least 1–2 weeks to account for traffic fluctuations, and a 95% confidence level should be required before declaring winners. For scaling, consider a hybrid structure: a centralized "Center of Excellence" to maintain statistical rigor, paired with decentralized teams to execute tests quickly. This balance allows you to increase testing speed without compromising data accuracy. By adhering to these principles, you’ll stay aligned with the systematic, data-driven culture emphasized throughout this guide.
"The difference between good and great experimentation isn’t tools or talent, it’s a systematic approach across metrics, velocity, techniques, and culture." – Mark Wakelin, Principal Consultant, Strategy & Value
Conclusion: Using A/B Testing to Drive Business Growth
Scaling A/B testing isn’t just about running more experiments – it’s about building a structured process that turns raw data into actionable insights. Successful companies prioritize evidence over intuition. Take Peloton, for instance: by introducing a centralized testing repository and standardized workflows in March 2025, they increased win rates and cut down analysis time significantly. This demonstrates the impact of treating experimentation as an integrated system rather than isolated projects.
The framework we’ve outlined – from defining clear KPIs to automating workflows and ensuring statistical precision – creates clarity and alignment across teams. It eliminates internal debates and streamlines decision-making. For example, 7-Eleven automated their A/B testing processes and slashed reporting times from 100 hours to just 1 hour. This kind of systematic approach shifts the focus from firefighting data issues to deriving meaningful insights that drive strategic decisions.
While the 90-day implementation plan offers a solid starting point, long-term success depends on fostering a culture of continuous learning. High-performing teams know that only 10–30% of experiments yield clear winners. The real value comes from documenting both wins and losses, ensuring insights are shared and accessible across the organization.
Sustainable growth comes from consistently refining your strategy. Businesses achieving 12–18% conversion improvements and 20% revenue growth aren’t just running tests – they’re embedding learning into their operations. By focusing on impactful experiments, using frameworks like ICE, protecting the user experience with guardrail metrics, and automating repetitive tasks, teams can work faster and smarter.
From setting goals to automating processes, every step in this guide reinforces the importance of data-driven decision-making. Graystone Consulting specializes in helping founder-led and growth-stage companies build scalable marketing systems. Their diagnostic audits uncover revenue leaks, while their growth system installations create the infrastructure needed for effective experimentation. If you’re ready to elevate A/B testing into a strategic tool for growth, this guide provides the roadmap to get started.
FAQs
What’s the best way for growth-stage businesses to prioritize A/B testing?
For businesses in the growth stage, running A/B tests effectively means starting with a clear focus on key business objectives – whether that’s improving conversion rates, increasing user engagement, or driving revenue growth. The idea is to prioritize experiments that align closely with these goals and can deliver a noticeable impact on your growth metrics.
To make the process more efficient, take advantage of automation tools. These tools can simplify test execution and streamline data collection, which is especially helpful for smaller teams with limited resources. Each test should be grounded in a well-defined hypothesis, use sound statistical methods, and include measurable success criteria. By zeroing in on high-value experiments and relying on data-driven insights, businesses can make smarter choices and accelerate their growth trajectory.
What roles are essential for building a strong A/B testing team?
A strong A/B testing team brings together a variety of specialized roles, each contributing to the process’s success and reliability. Here’s a breakdown of the key players:
- Data Analyst or Data Scientist: These professionals dig deep into the numbers, interpreting test results and turning data into actionable insights.
- Product Manager or Growth Manager: They define the hypotheses, set clear objectives, and guide the overall testing process from start to finish.
- Developer or Engineer: Responsible for implementing test variations and ensuring everything runs smoothly on the technical side.
- Designer or UI/UX Specialist: Focused on crafting user-friendly designs that align with the testing goals and enhance the user experience.
Sometimes, a Marketing or Content Specialist joins the team to fine-tune messaging for specific audiences, ensuring the test resonates effectively. Clearly defining these roles and fostering collaboration among team members is essential for building a data-driven approach that enhances user experience and drives higher conversions.
How can automation improve the efficiency of A/B testing for growth-stage businesses?
Automation takes the hassle out of A/B testing by simplifying essential tasks like audience segmentation, test setup, and data collection. With fewer manual steps involved, teams can conduct more tests in a shorter amount of time, allowing for quicker adjustments and improvements. Plus, automation reduces the risk of human error, providing precise, data-backed insights that teams can trust.
On top of that, many automated tools work seamlessly with platforms like Slack or project management software. This makes it easier for teams to quickly act on test results, creating a more dynamic and responsive testing process. The result? A smoother path to continuous improvement and the ability to scale business strategies more efficiently.


0 Comments