


Want your referral program to succeed? Start by tracking the right KPIs.
Referral program KPIs measure how well your program performs in driving customer engagement and revenue. Without tracking these metrics, you can’t identify what’s working or where to improve.
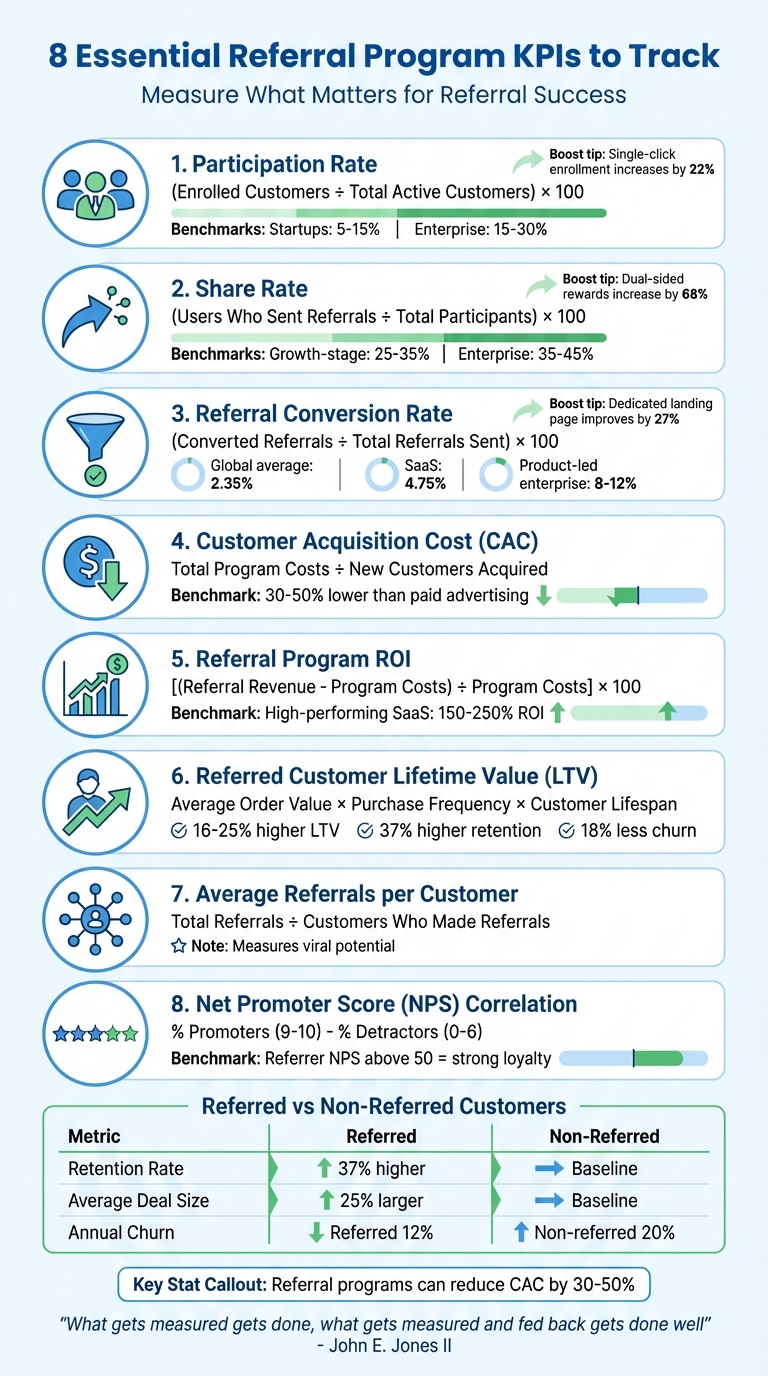
Here’s a quick breakdown of key KPIs to monitor:
- Participation Rate: Percentage of customers enrolled in the program.
- Share Rate: How many participants actively share referrals.
- Referral Conversion Rate: Percentage of referrals that turn into paying customers.
- Customer Acquisition Cost (CAC): Cost of acquiring new customers through referrals.
- ROI: Profitability of your referral program.
- Lifetime Value (LTV): Revenue generated by referred customers compared to non-referred ones.
- Average Referrals per Customer: Program’s viral potential.
- NPS Correlation: Links customer satisfaction to referral behavior.
Tracking these metrics helps pinpoint issues like low participation, weak conversions, or high costs. Use referral software for automated tracking, segment metrics for better insights, and test incentives to optimize results. A data-driven approach can make your referral program a powerful growth engine.
8 Essential Referral Program KPIs and Performance Benchmarks
Key Referral Program KPIs to Track
Understanding the right metrics is crucial for evaluating the success of your referral program. Let’s break down the key performance indicators (KPIs) that give you a clear picture of how well your program is doing.
Participation Rate
The participation rate shows the percentage of your customers who enroll in your referral program. You calculate it by dividing the number of enrolled customers by your total active customer base, then multiplying by 100.
This metric highlights whether customers are aware of your program and find it appealing. If participation is low, it could mean the program lacks visibility or fails to grab attention. Startups generally see participation rates of 5-15%, while enterprise companies achieve 15-30%. Want a quick boost? Single-click enrollment can increase participation by 22%.
Share Rate
Share rate tracks how many participants actively send referral invites. The formula is: (Users Who Sent Referrals ÷ Total Program Participants) × 100.
This metric digs deeper than enrollment, showing how engaged participants are. Growth-stage companies average 25-35% share rates, with enterprise programs hitting 35-45%. Adding dual-sided rewards – where both referrer and referee benefit – can increase participation by 68%.
Referral Conversion Rate
This metric measures the percentage of referred leads who turn into paying customers. The formula: (Converted Referrals ÷ Total Referrals Sent) × 100.
A strong conversion rate reflects the quality of referrals and how effective your sales funnel is. On average, the global rate is 2.35%, while SaaS companies see around 4.75%. Product-led enterprise companies often reach 8-12% conversion rates. A dedicated landing page for referred traffic can improve conversions by 27%.
Customer Acquisition Cost (CAC) from Referrals
CAC from referrals is calculated by dividing total program costs – like incentives, platform fees, and operational expenses – by the number of new customers acquired through referrals.
This metric shows how cost-efficient your referral program is. Referral programs typically slash CAC by 30-50% compared to paid advertising. If your referral CAC is higher than other channels, it’s time to revisit your incentive structure or operational costs.
"Referred customers generally convert at higher rates, improving CAC efficiency." – Friendbuy
Referral Program ROI
ROI measures the profitability of your referral program. Use this formula: [(Referral Revenue – Program Costs) ÷ Program Costs] × 100.
This metric determines whether your program is worth the investment. High-performing SaaS programs often achieve 150-250% ROI. To get an accurate picture, include all costs – platform fees, rewards, and staff time.
Referred Customer Lifetime Value (LTV)
Referred customer LTV estimates the total revenue a referred customer generates over their lifetime. Use this formula: Average Order Value × Purchase Frequency × Customer Lifespan.
Compare referred customer LTV to non-referred customers to see if referrals bring in better-quality customers. Referred customers typically generate 16-25% higher LTV. They also boast 37% higher retention rates and are 18% less likely to churn.
| Metric | Referred Customers | Non-Referred Customers |
|---|---|---|
| Retention Rate | 37% higher | Baseline |
| Average Deal Size | 25% larger | Baseline |
| Annual Churn | 12% | 20% |
Average Referrals per Customer
This KPI measures your program’s viral potential by dividing total referrals by the number of customers who made at least one referral.
A higher average indicates strong word-of-mouth advocacy. Introducing tiered rewards for multiple referrals (e.g., bonuses for 5+ referrals) can encourage even more sharing.
Net Promoter Score (NPS) Correlation
NPS correlation links customer satisfaction with referral behavior. NPS is calculated by subtracting the percentage of detractors (scores 0-6) from promoters (scores 9-10).
A Referrer NPS above 50 signals strong loyalty. Customers who score you 9 or 10 are far more likely to refer others. Sending referral invites right after a positive NPS score can maximize this opportunity.
"CLV is a powerful and insightful metric that can help us measure and improve the impact of our referral programs on our business growth." – David Skok, Venture Capitalist
sbb-itb-ad881f4
How to Use KPIs to Fix Program Problems
Tracking KPIs helps pinpoint where your referral program might be struggling, allowing you to address issues quickly and effectively.
Finding Weak Points with KPIs
Low participation rates often mean customers either don’t know about your program or don’t find it appealing enough to join. To tackle this, ensure the program is highly visible by placing links in key areas like your homepage, customer accounts, and FAQs. Also, streamline the signup process so it takes less than 30 seconds.
High visits but low share rates suggest that while customers are exploring the program, the rewards might not be enticing enough to encourage referrals. To find the right incentive, try A/B testing different reward options, such as cash versus store credit or single versus dual rewards.
Low conversion rates highlight issues with how referred friends experience the program. If sharing is happening but conversions aren’t, your landing page or messaging could need adjustments. A dedicated referral landing page can increase conversions by 27%. Experiment with elements like headlines, trust badges, or making the referrer’s name more prominent to build trust. Including the referrer’s name on the page is particularly effective, as it creates a "trust transfer" that encourages conversions.
Negative ROI or high CAC from referrals can indicate that your reward structure is either too expensive or attracting low-value customers. To address this, ensure your attribution model excludes existing leads and automate reward fulfillment to cut operational costs.
High churn among referred customers may point to a mismatch in value perception. This could mean your incentives are attracting people who are more interested in rewards than in your product. By reviewing churn rates alongside conversion and participation metrics, you can get a clearer picture of your program’s overall health.
Breaking down your KPIs into specific segments can make it easier to identify and fix these issues.
Segmenting Metrics for Better Insights
Segmenting KPIs by customer type, channel, or campaign can reveal patterns you might otherwise miss. For instance:
- Channel segmentation helps you see which platforms – like email, SMS, WhatsApp, or social media – bring in the best leads. Neutrogena found in 2024 that email blasts accounted for 30% of their referral revenue, allowing them to focus more resources on email campaigns.
- Customer type segmentation lets you identify which groups, such as enterprise vs. SMB or new vs. loyal customers, are the most effective advocates.
- Device segmentation (mobile versus desktop) can uncover technical issues. With 65% of referrals happening on mobile, a poor mobile experience might be holding back your share rate.
- Campaign-level tracking allows you to test different messaging strategies. For example, if one campaign sees high shares but low conversions, the problem might be how the offer is presented to the referred friend rather than the advocate.
KPI Comparison Table
| KPI | Implementation Complexity | Key Insights | Resource Needs | Ideal Use Case |
|---|---|---|---|---|
| Share Rate | Low | Advocate motivation & incentive appeal | Basic tracking pixels | Testing new reward structures |
| Conversion Rate | Medium | Landing page UX & offer strength | CRM/Sales integration | Optimizing the friend’s journey |
| ROI | High | Financial health & profitability | Full-funnel financial data | Budget allocation & scaling |
| NPS Correlation | Low | Customer satisfaction & advocacy potential | Survey tools | Identifying "Super-Advocates" |
| Viral Coefficient | Medium | Growth potential | Referral & conversion data | Predicting long-term growth |
"If you get enough people in the top, and you’ve got all the different stages, you want to be able to track where people leak out and how you can fix it. Having a platform that lets you know they’re leaking out at this stage lets you go and fix something very quickly." – Peter Cunningham, Director of Marketing, Buyapowa
Best Practices for Ongoing KPI Monitoring
Tracking KPIs once and then ignoring them won’t cut it if you want your referral program to thrive. Success depends on creating a system that keeps a constant eye on performance, allowing you to make quick adjustments when issues arise. This approach ensures you can act on insights from your KPI data and address problems before they snowball.
Automating KPI Tracking
Manually tracking KPIs is not only tedious but also prone to errors. Instead, leverage referral software to handle automatic attribution, fraud prevention, and reporting. These tools rely on unique referral links and coupon codes to instantly identify conversions, saving you time and effort.
For even greater accuracy, server-side API tracking can bypass challenges like ad blockers, privacy settings, and cleared cookies. This method ensures precise conversion data, even in tricky scenarios.
Webhook integration can connect your referral software with payment processors, triggering rewards as soon as payments are confirmed. This eliminates the hassle of manual reward processing and provides instant gratification for your advocates. On top of that, syncing with CRMs like HubSpot or Salesforce makes it easy to track revenue attribution throughout your sales funnel.
Adding UTM parameters to referral links can capture detailed data about which platforms – email, social media, SMS, or WhatsApp – are driving the most traffic and conversions. With this information, you can pinpoint top-performing channels and allocate resources to maximize results.
"A referral program without tracking is like a sales team without a commission structure. It lacks the fundamental motivation and measurement needed for success." – Ollie Efez
By automating these processes, you’ll have reliable, real-time data at your fingertips, making it easier to set benchmarks and fine-tune your program.
Setting Benchmarks and Goals
Once automation is in place, the next step is to establish tailored consulting solutions and clear benchmarks to measure success. For instance, aim for a 15%-20% participation rate. If you’re falling short of this range, it could mean your program has too much friction or isn’t visible enough.
When it comes to conversion rates, a baseline of 10% is a good starting point, with 15% or more being an excellent target. Keep in mind that referred leads tend to convert 3 to 5 times better than cold leads, so if your rate is below 4%, it’s time to investigate.
Globally, the average referral rate (the percentage of purchases coming from referrals) hovers around 2.3%. However, some companies blow this figure out of the water. Farm Hounds, for example, achieved a 22.25% referral rate, generating over $600,000 in sales. Similarly, PayPal saw a 15% conversion rate during its expansion from 1 million to 5 million users, with a customer acquisition cost (CAC) as low as $1-$2.
It’s also smart to set different goals for different customer segments. Your most loyal advocates, often called "super-referrers", should have higher referral frequency targets than newer customers. Companies that actively monitor and refine their programs report 43% better results than those that don’t.
Refining Your Program Over Time
Referral programs aren’t a "set it and forget it" deal. To keep things running smoothly, conduct quarterly ROI reviews. If your CAC is too high, it might be a sign that your rewards are overly generous. On the other hand, low participation could mean your incentives aren’t appealing enough.
A/B testing is another powerful tool for fine-tuning your program. Test different types of rewards – cash versus store credit, single versus dual rewards, or time-sensitive offers like "sign up within 7 days for a bonus" – to see which ones deliver the best ROI, not just the highest volume.
Keep an eye out for fraud patterns in your KPI data. For example, a surge of referrals from a single IP address could indicate abuse. To safeguard your program, consider implementing payout delays (usually 30 days) to account for refunds or chargebacks before releasing rewards. This helps maintain trust with legitimate participants while deterring fraud.
"First of all, you need to promote your program across all touch points with your customers, so they actually know it exists… having a platform that lets you know they’re leaking out this stage and lets you go and fix something very quickly… can help you improve that funnel." – Peter Cunningham, Director of Marketing, Buyapowa
Conclusion
Keeping tabs on KPIs shows you what’s working, what’s broken, and where the untapped potential lies. Without regular measurement, your referral program operates in the dark, blending impactful metrics with those that don’t truly move the needle.
The numbers don’t lie: a well-tuned referral program can significantly boost marketing results. It drives better conversions, enhances customer value, and lowers churn. These improvements can slash customer acquisition costs by 30% to 50%, all while cultivating a more loyal customer base.
"What gets measured gets done, what gets measured and fed back gets done well, what gets rewarded gets repeated." – John E. Jones II
This underscores the importance of consistently refining your program using data. Start by zeroing in on the essentials: participation rate, conversion rate, and ROI. Automate your tracking for instant insights, and use this data to experiment quarterly with rewards, messaging, and sign-up flows. Businesses that rely on multi-metric dashboards improve their optimization cycles 22% faster than those sticking with single-metric tracking.
Think of referral ROI as a snowball effect. Even small gains in conversion rates and share frequency can lead to exponential growth over time. By automating KPI tracking and running frequent tests, you create a referral program that doesn’t just monitor performance – it evolves into a self-sustaining engine for growth.
Use these strategies to refine your referral program continuously and unlock long-term success.
FAQs
Which 3 KPIs should I track first?
When it comes to evaluating the effectiveness of your referral program, three key performance indicators (KPIs) stand out: share rate, referral conversion rate, and customer lifetime value (CLV).
These metrics provide essential insights:
- Share Rate: This measures how often customers are sharing your referral offer. A high share rate indicates that your program is engaging and easy to share.
- Referral Conversion Rate: This tracks how many of those shares actually lead to new customers. It’s a clear indicator of how compelling your offer is to potential referrals.
- Customer Lifetime Value (CLV): CLV helps you understand the long-term revenue generated by referred customers, giving you a sense of their overall impact on your business.
By focusing on these KPIs, you’ll not only gauge your program’s current performance but also uncover opportunities to refine and improve your referral strategy for better results.
How do I know if my referral incentives are too expensive?
To figure out if your referral program is paying off, compare the revenue generated by referred customers to the cost of the incentives you’re offering. If the expense of these rewards eats up too much of your return or the revenue from referrals doesn’t cover the costs, it’s a sign that your incentives might be too expensive. Keep an eye on key metrics like referral revenue, customer lifetime value (CLV), and ROI. These numbers will help you determine if your rewards are reasonable and if they align with your business objectives.
What should I fix if shares are high but conversions are low?
If your content is getting plenty of shares but not translating into conversions, the problem might be in how well those shares are driving customer action. Start by evaluating your referral incentives – are they appealing enough and easy to understand? Make sure the referral process is straightforward, with a clear and enticing call-to-action. You might also want to try personalized follow-ups to engage potential customers more directly. Fine-tuning these elements can turn shared traffic into actual revenue.


0 Comments