


When tracking marketing performance, not all metrics are equally useful. Some numbers, like follower counts or page views, may look impressive but don’t drive real business results. These are called vanity metrics – data points that create a false sense of progress without actionable insights. On the other hand, marketing metrics directly tie to business goals like revenue, customer acquisition, or retention, helping you make smarter decisions.
Key Takeaways:
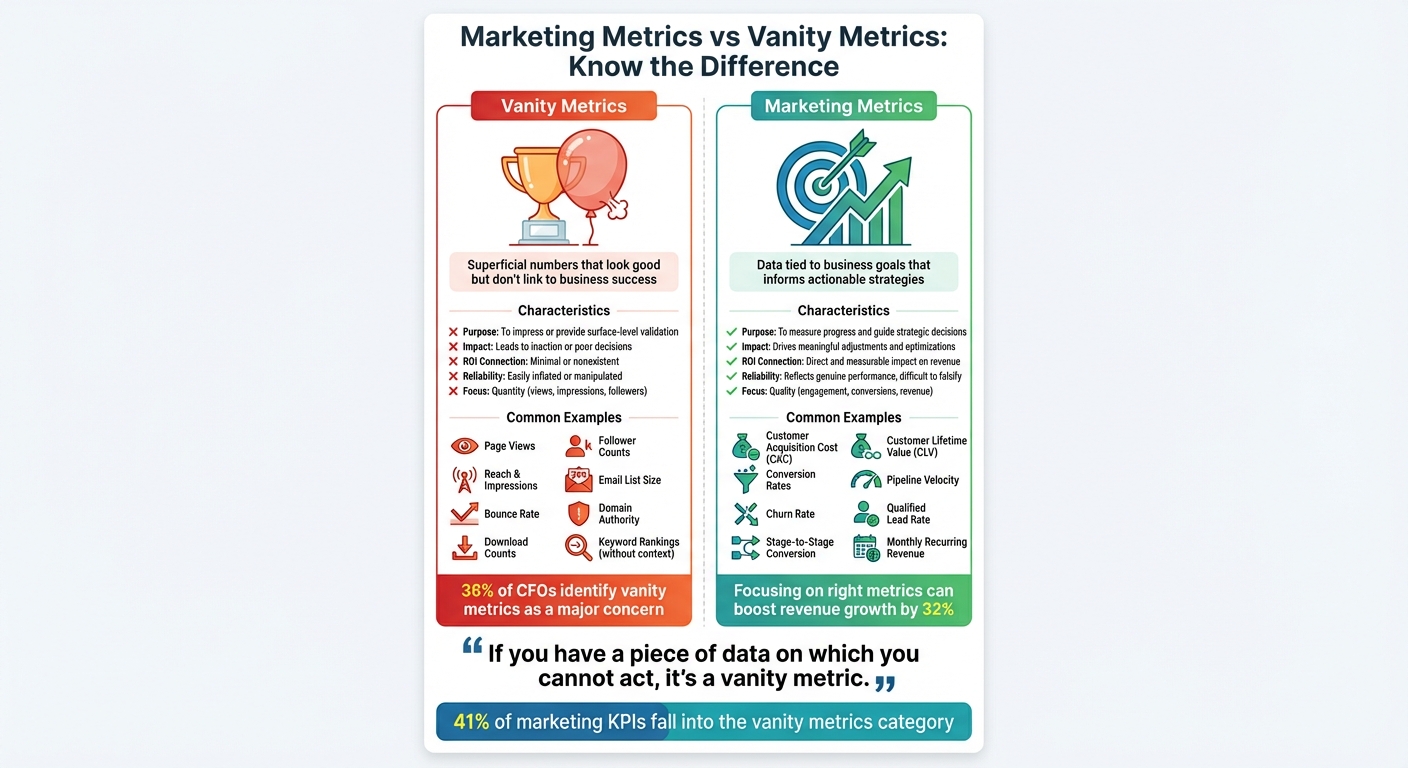
- Vanity Metrics: Superficial numbers (e.g., likes, impressions) that don’t connect to revenue or strategy.
- Marketing Metrics: Actionable data (e.g., conversion rates, customer acquisition cost) that guide decisions and improve ROI.
- Focusing on the right metrics can boost revenue growth by 32%.
Avoid misleading metrics like page views or follower counts unless paired with context. Instead, prioritize metrics that measure real outcomes, such as pipeline velocity, customer lifetime value (CLV), or churn rate. By aligning metrics with your business goals, you’ll ensure your marketing efforts drive meaningful growth.
Let’s dive into the details.
VANITY METRICS Vs ACTIONABLE METRICS.
What Marketing Metrics and Vanity Metrics Mean
Marketing Metrics vs Vanity Metrics: Key Differences and Examples
To refine your marketing strategy, you first need to understand the metrics you’re tracking. Not all data points are equally valuable. The right metrics can accelerate growth, while the wrong ones can lead you astray. This distinction is essential as we dig into the systems that support sustainable progress.
What Are Vanity Metrics?
Vanity metrics are flashy numbers that might look impressive but fail to provide the depth needed for meaningful decisions. These metrics are often easy to inflate and offer a surface-level sense of achievement without driving real strategy.
At their core, vanity metrics emphasize quantity over quality. Think total page views, follower counts, or email open rates. Sure, they might sound great in a presentation, but they don’t answer the critical question: "What action should we take next?". If a metric changes and it doesn’t lead to a clear decision or adjustment, chances are, it’s a vanity metric.
The real danger? Vanity metrics can create a false sense of accomplishment. Take Janet Aronica, a marketing manager for a literary blog in 2021. Her campaign generated an impressive 50,000 monthly page views. But when she examined the numbers closely, she realized those visits weren’t converting into product sales. The page views looked great on paper but didn’t translate into tangible business results.
This issue isn’t just anecdotal. Research shows that 36% of CFOs identify vanity metrics as a major concern, often viewing them as evidence that marketing is an expense rather than a growth driver.
While vanity metrics might boost confidence temporarily, they lack the power to deliver actionable insights or drive real outcomes.
What Are Marketing Metrics?
Marketing metrics – also referred to as actionable metrics or performance metrics – are numbers that directly align with business goals. These metrics help you diagnose issues, make informed decisions, and adjust your strategy.
The key difference lies in their cause-and-effect clarity. Marketing metrics like customer acquisition cost (CAC), pipeline velocity, or conversion rates show exactly how your efforts impact results. They answer questions like: "Is this campaign generating profit?" "Which channels bring in the best leads?" "Are we keeping customers loyal?"
Unlike vanity metrics, marketing metrics are harder to manipulate and provide a reliable snapshot of actual performance. They tie directly to revenue, making it possible to demonstrate marketing’s ROI in clear financial terms.
Key Differences Between the Two
Here’s a side-by-side comparison that highlights the contrast:
| Aspect | Vanity Metrics | Marketing Metrics |
|---|---|---|
| Definition | Superficial numbers that look good but don’t link to business success | Data tied to business goals that informs actionable strategies |
| Core Purpose | To impress or provide surface-level validation | To measure progress and guide strategic decisions |
| Impact on Decisions | Often leads to inaction or poor decisions based on misleading data | Drives meaningful adjustments and optimizations |
| Connection to ROI | Minimal or nonexistent; hard to connect to revenue | Direct and measurable impact on revenue |
| Reliability | Easily inflated or manipulated (e.g., bots, fake followers) | Reflects genuine performance and is difficult to falsify |
| Focus | Quantity (e.g., total views, impressions, followers) | Quality (e.g., engagement, conversions, revenue per customer) |
Grasping this distinction is a crucial step toward building a measurement framework that truly supports growth. The next challenge? Identifying which metrics might be leading your team down the wrong path.
Vanity Metrics That Mislead Growth-Stage Businesses
Growth-stage businesses often get caught up chasing numbers that look impressive but fail to deliver real value. According to Forbes, 41% of marketing KPIs fall into the category of vanity metrics – metrics that generate noise but don’t shed light on what truly drives success. Let’s break down some of the most common examples across different channels.
Website and Content Vanity Metrics
Page views are often viewed as a sign of success. Sure, seeing 10,000 monthly views might feel like a win, but if those visitors aren’t part of your ideal customer profile, those numbers are hollow. In fact, 100 views from the right audience are far more impactful than thousands of unqualified clicks. This metric doesn’t tell you whether your content is resonating or if it’s driving meaningful engagement.
Likewise, bounce rate can be misunderstood. A high bounce rate isn’t always a red flag. Sometimes, visitors find exactly what they’re looking for and leave satisfied – that’s not necessarily a bad thing.
Keyword rankings are another common trap. Ranking #1 for a term like “free marketing tools” might sound great, but if it doesn’t bring in qualified leads, it’s just noise. On the other hand, ranking #5 for a term like “best enterprise marketing automation software” could result in higher conversions and revenue. The key is understanding the intent and value behind the traffic.
Then there’s Domain Authority (DA), a score created by third-party tools to estimate a site’s ability to rank. While it’s tempting to chase a higher DA, it’s worth noting that Google doesn’t use this metric directly. Obsessing over DA can lead to questionable tactics, like aggressive link-building, and doesn’t guarantee better performance. In fact, competitors with lower DA scores often outperform simply by creating stronger, more relevant content.
Social platforms also present their own set of misleading metrics.
Social Media Vanity Metrics
Follower counts can be one of the most deceptive metrics. Having 100,000 followers might look impressive, but if most of them are disengaged, inactive, or even purchased, those numbers mean nothing. Similarly, reach and impressions might tell you how many people saw your content, but they don’t reveal whether anyone actually engaged with it in a meaningful way.
As John Cutler, former Product Evangelist at Amplitude, wisely said:
"Vanity metrics make us feel good but don’t help us do better work or make better decisions. Vanity metrics put optics before rigor, learning, and transparency".
The same logic applies to email and advertising metrics.
Email and Advertising Vanity Metrics
A large email list can create a false sense of accomplishment. If most subscribers are unengaged or inactive, it not only skews your performance metrics but also increases costs and harms deliverability rates. Similarly, open rates can be misleading, as they’re often inflated by auto-opens or casual clicks that don’t reflect genuine interest. Even click counts don’t always indicate intent – sometimes they’re just driven by curiosity.
Marketing Qualified Leads (MQLs) are another tricky area. While MQLs signal that a prospect has taken some action, like downloading a resource, a bloated list of low-quality leads can overwhelm your team and waste valuable resources.
Lastly, download counts – whether for apps, PDFs, or software – can easily mislead. For instance, one million app downloads might sound like a big win, but if 90% of users uninstall within a week, the metric loses its shine.
The common thread across all these metrics is clear: they measure activity, not outcomes. They answer “how much?” but fail to address the critical “so what?” For growth-stage businesses, the focus should always be on metrics that drive actionable insights and measurable results.
Marketing Metrics That Matter for Growth-Stage Businesses
When it comes to growth-stage businesses, tracking the right marketing metrics can make all the difference. These metrics don’t just show activity – they directly connect to outcomes like revenue, customer acquisition, and retention. On the flip side, vanity metrics may look good on paper but rarely lead to meaningful results. Let’s break down the metrics that truly matter at every stage of your funnel.
Top-of-Funnel Metrics
At the top of the funnel, it’s all about turning visitors into leads and ensuring your efforts are efficient.
- Visitor-to-lead conversion rate: This metric shows how well your content is converting traffic into leads. For example, if 10,000 visitors only result in a 0.5% conversion rate, it’s likely a sign that your messaging or targeting is off. A healthier range is typically between 2–5%.
- Cost per qualified lead: This measures how much you’re spending to bring in high-quality leads. If costs are climbing while lead quality drops, it’s a red flag that your targeting might be off, or you’re overspending on the wrong audience.
- Qualified lead rate: This tells you the percentage of leads that are actually worth pursuing. It’s a critical measure of whether your messaging and targeting are attracting the right people. Interestingly, only 23% of marketers feel confident they’re tracking the right KPIs.
Once you’ve identified high-quality leads, the next step is ensuring they move smoothly through your pipeline.
Mid-Funnel Pipeline Metrics
The middle of the funnel is where leads turn into real opportunities. Here are the metrics that help you spot bottlenecks and improve efficiency:
- Opportunity creation rate: This measures how many qualified leads are turning into sales opportunities. For many B2B companies, the conversion from Marketing Qualified Lead (MQL) to Sales Qualified Lead (SQL) is a common sticking point, with rates averaging 12–21% across industries. Even a small improvement – say, a 5% increase – can boost revenue by up to 18%.
- Pipeline velocity: This tracks how quickly deals move through the funnel. For B2B SaaS companies, the average sales cycle is 84 days, but an optimal range is closer to 46–75 days. If deals are dragging on, it might be time to refine your sales process or revisit your target accounts.
- Stage-to-stage conversion rates: This metric shows where deals are stalling. For instance, SQL-to-opportunity conversion rates average 42% for small- to midsize businesses and 36% for enterprise organizations. Falling below these benchmarks highlights areas that need attention.
Revenue and Retention Metrics
Once leads progress through the funnel, the focus shifts to revenue generation and customer retention.
- Customer Acquisition Cost (CAC): This metric calculates how much you’re spending on sales and marketing to acquire each new customer. It’s a key indicator of whether your growth strategy is financially sustainable.
- Customer Lifetime Value (CLV): CLV estimates the total revenue a customer will bring in over the course of their relationship with your business. A solid CLV-to-CAC ratio is typically 3:1 or higher, showing that your acquisition costs are paying off in the long run.
- Churn rate and expansion revenue rate: These metrics reveal whether you’re keeping customers and growing revenue. Retention is critical – it’s five times cheaper to retain an existing customer than to acquire a new one. Expansion revenue, which comes from upselling or cross-selling to current customers, often becomes a key driver of growth for more mature businesses.
Businesses that actively track these metrics are twice as likely to achieve their strategic goals. Yet, surprisingly, 74% of underperforming companies fail to monitor their KPIs effectively. By focusing on these metrics – from acquisition to retention – you’ll ensure every decision is tied to measurable outcomes, paving the way for sustainable growth.
sbb-itb-ad881f4
How to Turn Vanity Metrics into Useful Insights
Vanity metrics often lack meaning unless paired with proper context. Looking at metrics in isolation can make it hard to see their true value. However, with the right analysis, even basic stats like page views or follower counts can uncover helpful insights about your business.
Focus on Quality Over Quantity
Raw numbers alone don’t tell the whole story. For instance, having 50,000 website visitors sounds impressive, but what does it mean without understanding their behavior? A 2% conversion rate from 10,000 visitors generates more qualified leads than a 0.5% rate from 50,000 visitors. The same principle applies to social media: instead of focusing on follower count, engagement rate (calculated by dividing comments, shares, and saves by reach) provides a clearer picture of how well your content resonates.
Microsoft Xbox made a similar shift in 2016 when it stopped emphasizing total console sales and started tracking monthly active users instead. Phil Spencer explained:
"The nice thing about us selling consoles is your console install base will always go up. But that’s not really a reflection of how healthy your ecosystem is. We focus on the monthly active user base because we know those are [people] making a conscious choice to pick our content, our games, our platform, our service".
By prioritizing quality over sheer volume, they redefined how success was measured, focusing on meaningful engagement rather than raw numbers.
Use a Full-Funnel Approach
Once you’ve shifted focus to quality, it’s crucial to connect metrics across the entire funnel. Top-of-funnel activity, like impressions or clicks, only matters if it leads to measurable outcomes further down. For example, a campaign that generates 100,000 impressions but results in zero leads or sales isn’t effective, no matter how impressive the reach looks.
To get a clearer picture, track how social media sessions convert into leads, how email clicks turn into opportunities, and ultimately, how these actions contribute to revenue. Businesses that align metrics with funnel stages consistently see better results. This approach ensures you’re not just measuring activity – you’re measuring outcomes that directly impact growth.
Track Metrics Over Time
Short-term spikes, like a viral post, might make your traffic graph look great, but they rarely create lasting impact. Instead, use month-over-month and year-over-year comparisons to identify meaningful trends. Cohort analysis can be particularly insightful for this. For instance, tracking trial-to-paid conversion rates across different customer groups over time can show whether recent product updates are making a difference.
Consider this example: a 25% increase in activation rate could result in a 34% boost to monthly recurring revenue, but you’d only notice this by studying patterns over several months – not by celebrating a single week’s spike in signups. By focusing on long-term trends, growth-stage companies can refine their strategies and consistently achieve better outcomes.
Building a Metrics Operating System for Growth
What Is a Marketing Metrics Operating System?
A marketing metrics operating system is your go-to system for tracking KPIs across your business. It brings together tools like your CRM, marketing automation platform, and analytics software into one clear and comprehensive view. This system maps out metrics for every stage of your funnel – from awareness to loyalty – so your entire team works from the same data set.
Imagine the difference: instead of juggling multiple dashboards to evaluate campaign performance, you have a single, unified source of truth. This clarity not only simplifies decision-making but also connects marketing activities directly to revenue. When executed well, this approach can lead to a 32% boost in revenue growth.
Graystone Consulting‘s Approach
Graystone Consulting takes a methodical, three-phase approach to building a metrics operating system.
- Diagnostic Sprint: Start by auditing your entire funnel. This phase establishes KPI baselines and identifies any areas where revenue is leaking.
- Growth System Installation: Here, the focus is on integrating your marketing infrastructure. Graystone sets up CRM workflows, builds automation sequences, connects your ad stack, and creates live KPI dashboards.
- Leadership Retainer: This final phase provides ongoing support with fractional CMO oversight. Through weekly or biweekly strategy sessions, Graystone ensures your team stays focused on the right metrics and tracks progress effectively.
By replacing vanity metrics with data tied to real business outcomes, this structured process can deliver a 15–20% lift in funnel performance.
Framework for Consistent KPI Management
Once your metrics operating system is up and running, maintaining consistent KPI management is key to achieving long-term growth.
The focus should be on simplicity and relevance. Start by selecting KPIs that directly align with your business goals – not just metrics that are easy to track. Define clear, measurable benchmarks for each KPI, assign team members to own these metrics, and review them weekly to ensure alignment.
Visualization tools can help make trends more apparent, but don’t stop at the visuals. Add concise commentary to explain changes and their potential impact. This approach keeps your team focused on actionable insights rather than just numbers. The goal is to create a rhythm where your team regularly asks questions like: What decisions can we make based on this metric? How do we replicate this success? Does this data truly reflect reality?
Involving stakeholders from different departments in the KPI development process also makes a big difference. When everyone has a hand in shaping the metrics, alignment improves, and teams are more likely to buy into the system. This collaborative effort ensures your metrics operating system becomes a tool for driving measurable growth – not just another reporting mechanism.
Conclusion: Focus on Metrics That Drive Growth
Aligning your metrics with actionable outcomes is the cornerstone of achieving sustainable growth. Vanity metrics might look impressive on the surface, but they only matter if they lead to real business decisions. As Alistair Croll and Benjamin Yoskovitz wisely noted:
"If you have a piece of data on which you cannot act, it’s a vanity metric. If all it does is stroke your ego, it won’t help. You want your data to inform, to guide, to improve your business model, to help you decide on a course of action".
For growth-stage businesses, the focus must shift to metrics that directly impact revenue. This means prioritizing key performance indicators (KPIs) like customer acquisition cost, funnel conversion rates, monthly recurring revenue, and retention rates – metrics that are tied to tangible business outcomes.
A unified metrics system is essential. By connecting marketing activities directly to revenue, you can make decisions faster, identify potential revenue losses early, and ensure your team is aligned and working toward the same goals. This approach ties back to the earlier discussions on actionable metrics and their importance.
Graystone Consulting offers a proven three-phase framework – Diagnostic Sprint, Growth System Installation, and Leadership Retainer – that has consistently delivered a 15–20% improvement in funnel performance while creating sustainable growth systems.
When you track metrics that guide strategy, improve operations, and increase revenue, you set the stage for scalable and long-term growth. Focusing on data that drives meaningful decisions will help your business thrive.
FAQs
What’s the difference between vanity metrics and marketing metrics, and how can I focus on the right ones?
Vanity metrics, like social media follower counts or page views, might seem impressive at first glance, but they don’t tell you much about how your business is actually performing. On the other hand, marketing metrics are directly tied to your goals and have a real impact on outcomes – think conversion rates, customer retention, or revenue growth.
To zero in on the metrics that matter, focus on those that provide actionable insights and lead to measurable results. For instance, instead of just keeping tabs on website traffic, dig deeper into metrics like click-through rates, lead generation, or the increase in sales. When your metrics are aligned with your business objectives, it becomes much easier to evaluate your progress and make well-informed decisions that drive growth.
Why should growth-stage businesses avoid relying on vanity metrics?
Vanity metrics often give a surface-level boost to growth-stage businesses, showcasing numbers like social media followers or website traffic. While these figures might seem impressive at first glance, they rarely represent actual progress toward revenue generation, customer loyalty, or overall business growth.
Focusing too much on vanity metrics can pull attention away from data that truly matters – like customer acquisition costs (CAC), conversion rates, or lifetime value (LTV). For businesses aiming to grow meaningfully, it’s crucial to zero in on metrics that directly tie to your goals and deliver tangible results.
How can I turn vanity metrics into meaningful insights?
To turn vanity metrics into meaningful insights, begin by diving into audience behavior to grasp the story behind the numbers. Break your audience into segments based on common traits – like demographics or engagement habits – to spot patterns and trends. Prioritize metrics that tie directly to your business goals, such as conversion rates, customer lifetime value (CLV), or return on investment (ROI).
It’s also crucial to examine how vanity metrics – like likes or impressions – connect to tangible actions, such as click-throughs or purchases. This method allows you to pinpoint the metrics that genuinely fuel growth and align with your objectives.


0 Comments