


Your B2B landing page’s performance hinges on key metrics like conversion rates, bounce rates, and load speed. Here’s what you need to know:
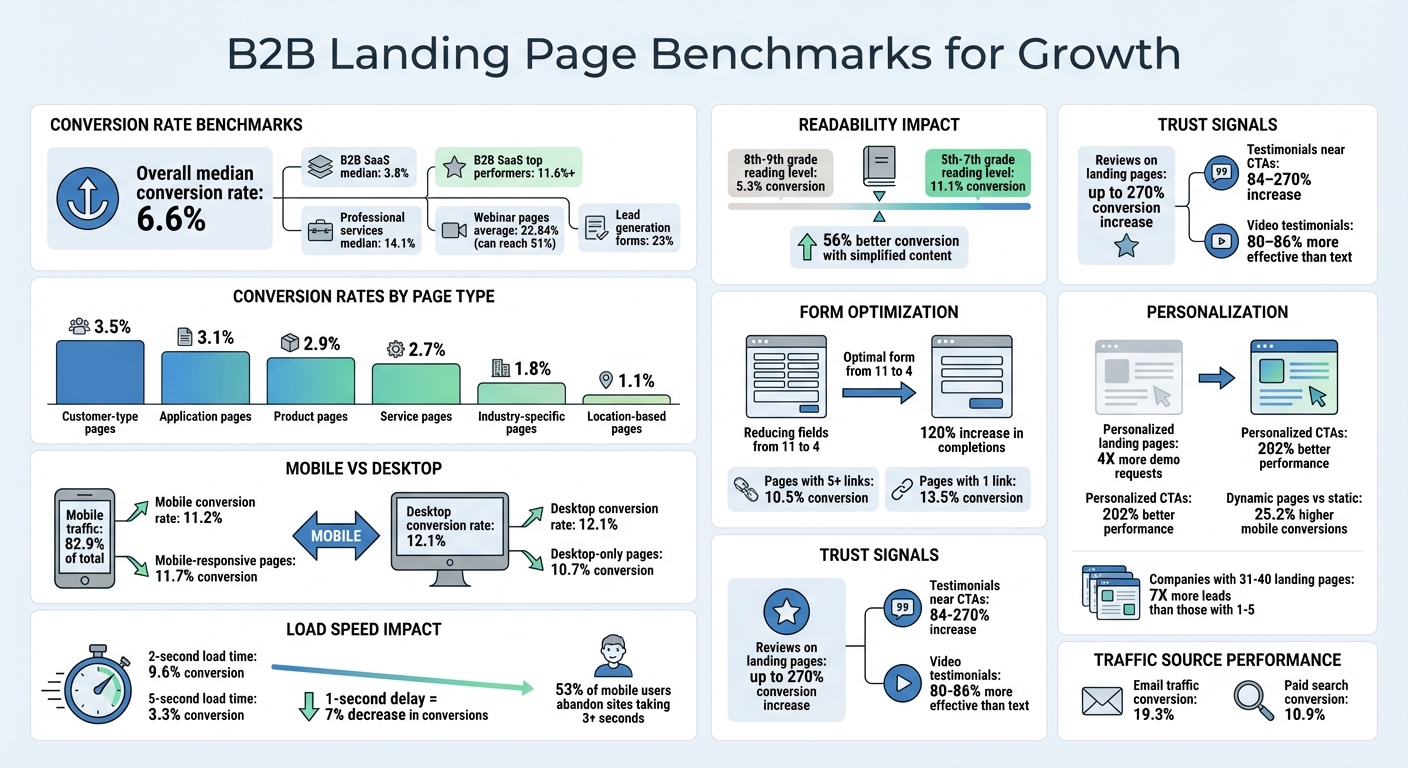
- Median Conversion Rates: B2B SaaS pages average 3.8%, while top performers hit 11.6%. Webinar pages convert much higher, averaging 22.84%.
- Mobile vs. Desktop: Mobile drives 82.9% of traffic, but desktop conversions slightly edge out at 12.1% vs. 11.2%.
- Readability Matters: Pages written at a 5th–7th grade level convert at 11.1%, compared to 5.3% for more complex language.
- Speed is Critical: Pages loading in 2 seconds convert at 9.6%, while slower pages (5 seconds) drop to 3.3%.
- Form Design: Reducing fields from 11 to 4 can boost completions by 120%.
- Trust Signals Work: Testimonials and certifications near CTAs can increase conversions by up to 270%.
To improve, focus on simplifying content, optimizing for mobile, speeding up load times, and leveraging A/B testing for continuous improvement.
B2B Landing Page Performance Benchmarks: Key Metrics and Conversion Rates
B2B Landing Page Conversion Rate Benchmarks
Median, Average, and Top-Tier Conversion Rates
Median conversion rates provide a more accurate picture by avoiding the skew caused by extreme outliers. Across industries, the median conversion rate sits at 6.6%, offering a solid benchmark for evaluating performance.
In the B2B SaaS space, the median conversion rate drops to 3.8%, while top-tier pages achieve rates of 11.6% or higher. Professional services, with their more tailored offerings, perform even better, reaching a median of 14.1%. These numbers reflect the challenges specific to B2B, such as complex products and longer sales cycles, especially when compared to high-urgency sectors like legal or financial services.
At the top end, conversion rates range widely by industry – from 11.4% to as high as 40.8%. This range highlights the potential for improvement when businesses identify and address the key factors that drive conversions.
Now, let’s explore how conversion rates differ based on the type of landing page.
Conversion Rates by Page Type
The type of landing page plays a significant role in shaping conversion rates. Here’s how different page types stack up:
- Customer-type pages: These pages, designed for specific client profiles, achieve a conversion rate of 3.5%.
- Application pages: Focused on showcasing solutions to particular problems, these pages convert at 3.1%.
- Product pages: Targeting transactional search intents, these pages perform at 2.9%.
- Service pages: Slightly behind product pages, service pages convert at 2.7%.
Pages like product and service pages tend to perform relatively well because visitors landing on them are often further along in their decision-making process.
On the other hand, industry-specific pages and location-based pages underperform, converting at 1.8% and 1.1%, respectively. Location pages often struggle due to duplicate content, while industry-specific pages may lack the focus needed to address individual visitor needs.
Interestingly, webinar landing pages and lead generation forms show much stronger results. Webinar pages average a conversion rate of 22.84%, with some reaching as high as 51%. Similarly, lead generation forms on landing or sales pages perform well, converting at 23%.
B2B vs. B2C Benchmarks
B2B visitors tend to exhibit higher intent compared to B2C consumers, leading to different behaviors and conversion dynamics. This intent-driven traffic is a major reason why optimized B2B landing pages often achieve stronger conversion rates.
The type of conversion goal also plays a role. B2B conversions typically involve higher-friction actions, such as signing up for a product demo or downloading a technical whitepaper. Despite these challenges, targeted and well-optimized B2B pages consistently outperform more generic approaches by aligning closely with visitor needs.
For example, financial services boast a median conversion rate of 8.3%, while education performs similarly at 8.4%. In contrast, ecommerce sees a median rate of 4.2%, and fashion and beauty lag behind at just 1.3%. These differences largely come down to urgency and intent, with B2B visitors typically having clearer goals and motivations.
These benchmarks provide valuable insights for refining landing pages to meet the specific intent of visitors and improve conversion performance.
sbb-itb-ad881f4
Engagement Metrics That Affect Landing Page Performance
Load Speed and User Experience
The speed at which your landing page loads can make or break its performance. A delay of just one second can decrease conversions by 7%, while pages that load in a single second convert three times better than those that take five seconds to load. For mobile users, the stakes are even higher – 53% of them will leave a site if it takes more than three seconds to load. Landing pages that load within two seconds boast an average conversion rate of 9.6%, compared to a mere 3.3% for pages that take five seconds. On top of that, faster load speeds enhance SEO rankings and increase trial sign-ups. Even a slight delay of 100 milliseconds can reduce sales by 1%.
From here, let’s explore how bounce rates and time spent on a page reflect deeper engagement patterns.
Bounce Rates and Time on Page
Bounce rates are another key indicator of landing page performance, and they’re closely tied to load speed. These rates generally fall between 60% and 90%. For example, reducing load times from three seconds to one can lower bounce rates by 32%, whereas delays of two to five seconds may cause bounce rates to skyrocket by 90%.
The complexity of your content also plays a role in keeping users engaged. Landing pages written at a 5th–7th grade reading level convert 56% better than those written at an 8th–9th grade level. Additionally, there’s a 24.3% negative correlation between the use of complex words (three or more syllables) and conversion rates. This is especially important for B2B audiences, who are often pressed for time. In fact, the average session length for B2B buyers has dropped from two minutes on desktop to just one minute on mobile devices.
"B2B tech customers are impatient website browsers. The average session length… on mobile devices… dropped to about 1 minute." – Clear Digital
Design choices can further shape engagement. For instance, landing pages with five or more links convert at about 10.5%, while those with a single, prominent link achieve a higher conversion rate of 13.5%. Removing navigation menus altogether can nearly double conversions by keeping visitors focused on the main call-to-action.
Next, let’s examine how form design and mobile optimization impact user completions.
Form Abandonment and Mobile Optimization
Form design and mobile optimization are crucial to improving conversion rates. Simplifying forms is one of the most effective ways to boost completions. Reducing the number of fields from 11 to just 4 can increase conversions by 120%. The most successful forms often include only three fields. This is particularly important on mobile devices, where typing on small screens can lead to frustration and abandonment.
Mobile-responsive pages also outperform their desktop-only counterparts, converting at an average rate of 11.7% compared to 10.7%. However, mobile optimization remains a challenge – 88% of online consumers are unlikely to return to a site after a poor mobile experience. To avoid this, ensure that text is easy to read without zooming and that buttons are large enough to tap effortlessly. Dynamic, personalized landing pages can further improve mobile conversions, achieving 25.2% higher rates than static, one-size-fits-all pages. With mobile devices accounting for over 80% of landing page traffic, prioritizing a seamless mobile experience is essential for staying competitive.
Emerging 2026 Trends Affecting B2B Landing Page Performance
Personalized Landing Pages
Personalization has become a must-have for driving B2B revenue. Marketers who use personalized landing pages report 4X more demo requests compared to generic pages, while personalized calls-to-action (CTAs) perform 202% better than standard ones. To truly engage visitors, it’s no longer enough to just insert their name – one-to-one messaging that aligns with the initial outreach is key.
Modern tools like dynamic text replacement allow headlines to adapt based on a visitor’s source, while top-performing teams create persona- and industry-specific versions of their landing pages. Businesses with 31–40 landing pages generate 7X more leads than those with just 1–5 pages.
"Marketers that have integrated personalization are achieving record engagement and conversion rates. As we move further into 2025, the gap between companies embracing these innovations and those that don’t will only continue to widen." – Mark Bornstein, VP of Marketing, ON24
AI-driven tools are making personalization even more accessible. These tools can cut the time needed to create landing pages by up to 90%, enabling companies to quickly produce hundreds of niche-specific pages. Around 30% of companies now leverage AI to automatically direct traffic to the highest-performing variants.
This focus on personalization naturally leads to another critical element: building trust with potential buyers.
Trust Signals and Their Impact
Trust signals play a crucial role in overcoming the skepticism that often comes with B2B purchases. For instance, featuring reviews on landing pages can boost conversions by as much as 270%, while placing testimonials near CTAs or signup forms can lead to an 84% to 270% increase in conversions. However, placement matters – social proof hidden in the footer loses much of its impact.
The most effective testimonials are specific and results-driven. Instead of vague statements like "Great product!", testimonials that highlight measurable outcomes – such as "increased leads by 45%" – resonate more with potential buyers. Including details like the customer’s full name, title, company, and even a photo can further enhance credibility. Video testimonials are even more impactful, building trust 80% to 86% more effectively than text-based ones.
Security certifications, such as SOC 2, ISO, and GDPR compliance badges, are also critical trust signals. Placing these badges near form submission buttons can help reduce hesitation during data entry. By 2026, advanced landing pages are expected to use AI to display tailored trust signals based on visitor behavior or industry – addressing specific concerns for different stakeholders.
With trust in place, the next step for improving landing page performance is continuous optimization through A/B testing.
A/B Testing and Continuous Optimization
While only 1 in 8 A/B tests leads to significant results, ongoing testing can yield major gains. Simplifying elements like form fields and navigation has been shown to boost conversions by up to 120%, delivering an average ROI of 223%.
High-performing teams typically conduct 2–3 A/B tests per month, focusing on elements like headlines, CTA text and placement, form field counts, and the positioning of social proof. For example, in 2025, Oakland Community College revamped its admissions page by simplifying the copy and clarifying CTAs, leading to a 250% increase in conversions within five weeks. Similarly, Morehead State University saw a 22% increase in conversions by refining their campaign pages with testimonials and sharper differentiators.
Interestingly, readability also plays a big role. Landing pages written at a 5th–7th grade reading level convert 56% better than those targeting an 8th–9th grade level. And with 83% of landing page visits happening on mobile devices, it’s essential to prioritize mobile-specific designs during optimization tests – not just responsive desktop layouts.
How to Build B2B Landing Pages That Actually Convert
Next Steps for Improving Your Landing Pages
Start by calculating your baseline conversion rate using the formula: Total Conversions ÷ Total Visitors. Compare your results to the industry median of 6.6% to see where you stand.
Next, take a closer look at your metrics by page type and traffic source. Different types of B2B landing pages yield varying results. For example, Customer Type pages typically convert at 3.5%, while Location pages tend to be lower at 1.1%. Traffic sources also matter – a standout example is email traffic, which converts at an impressive 19.3%, far outpacing paid search at 10.9%. Knowing these nuances allows you to set realistic and tailored goals for each page.
With these benchmarks in mind, you can start making impactful changes. Simplify your landing page copy to a 5th–7th grade reading level, which has been shown to achieve an 11.1% conversion rate. Reduce the number of form fields – for example, cutting them from 11 to 4 can increase conversions by 120%. Also, aim for fast load times; keeping it under 2 seconds can boost your conversion rate to 9.6%.
Dive deeper into visitor behavior by using tools like heatmaps and session recordings. Strategically place testimonials and trust signals near your call-to-action buttons – this simple adjustment can increase conversions by anywhere from 34% to 270%. Don’t overlook mobile optimization, especially since mobile traffic is often a significant portion of your audience. These steps lay the groundwork for effective A/B testing.
Finally, make A/B testing a regular part of your strategy. Test individual elements like headlines, call-to-action placement, and form length. While only 1 in 8 tests yields meaningful results, the cumulative impact of these optimizations can lead to an average ROI of 223%. Jennifer Lombardi, Founder of Kiwi Creative, emphasizes the importance of this ongoing effort:
"Having a set-it-and-forget-it approach to landing pages is a one-way ticket to failure…or at least stagnation. Just like your website pages, you should be running A/B tests and updating these assets on the regular to optimize performance".
FAQs
What are the best ways to boost the conversion rate of my B2B landing page?
To improve the conversion rate of your B2B landing page, start by focusing on a smooth and intuitive user experience. Simplify navigation, craft clear and persuasive calls-to-action (CTAs), and ensure your page functions seamlessly on mobile devices. For context, industry data shows that median conversion rates sit around 6.6%. Financial services often outperform with rates of 8.4%, while SaaS typically sees lower rates at 3.8%.
Use data to uncover opportunities for improvement. This might include reducing load times, sharpening your messaging, or tailoring your design to better match the preferences of your target audience. Experimentation is also crucial – test different headlines, visuals, and form layouts to find what resonates most. Regular analysis and fine-tuning are essential for driving consistent growth and better engagement.
How does page load speed impact conversion rates?
Page load speed plays a crucial role in driving conversions. Studies reveal that most visitors anticipate a webpage to load within just 2 to 3 seconds. If it takes any longer, the likelihood of them leaving the site (bounce rate) skyrockets.
Here’s a striking example: when a page’s load time increases from 1 second to 3 seconds, bounce rates can jump by 32%. Slow-loading pages don’t just irritate users; they can also severely impact your ability to turn visitors into leads or customers. Prioritizing faster load times is key to keeping users engaged and boosting your site’s overall effectiveness.
Why is personalization essential for B2B landing pages?
Personalization plays a vital role in making B2B landing pages more engaging and relevant for visitors. When content is tailored to address the specific needs, challenges, or interests of your audience, it becomes more impactful and encourages action, ultimately boosting conversion rates.
This approach allows you to emphasize key pain points, present solutions tailored to specific industries, or speak directly to distinct customer segments. The result? Better user interaction and a higher likelihood of actions like completing forms or requesting demos. Research consistently shows that personalized landing pages deliver stronger results compared to generic ones, making them an essential tool for businesses aiming to drive growth.
0 Comments