


A/B testing is not optional for growth-stage businesses – it’s essential. Why? Because as your business scales, intuition alone won’t cut it—which is why we engage as your fractional CMO to bring data-driven leadership to your team. Data-driven decisions can help you avoid costly mistakes and uncover what truly works for your audience. Here’s the key takeaway: companies running 50+ experiments annually see 47% higher revenue growth and 38% better customer retention compared to those running fewer than 10 tests.
What You’ll Learn:
- How to plan A/B tests effectively: Set clear goals, prioritize high-impact areas, and craft strong hypotheses.
- Test execution essentials: Focus on one variable at a time, ensure random user allocation, and monitor statistical validity.
- Analyzing results for actionable insights: Track both primary and secondary metrics, ensure statistical significance, and document findings to refine future experiments.
- Scaling winning variations: Roll out successful changes systematically and maintain a backlog of test ideas.
Pro tip: Only about 12.5% of experiments deliver positive outcomes, but every test – win or lose – provides valuable insights. Stick to a structured process, and you’ll see incremental gains that compound over time.
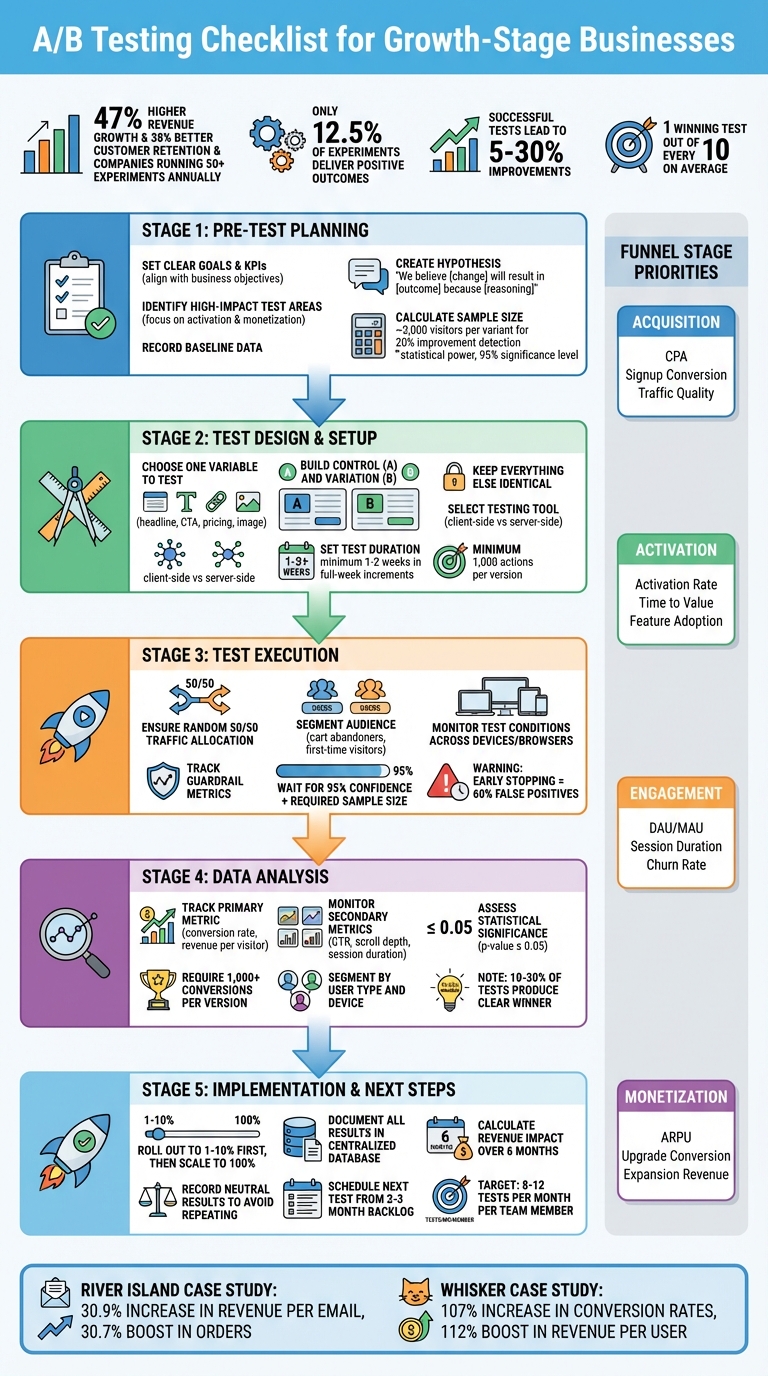
A/B Testing Process Checklist for Growth-Stage Businesses
A/B Testing at scale: Building an A/B testing culture from the ground up – EvolveDigital NYC 2025

sbb-itb-ad881f4
Pre-Test Planning Checklist
Every successful A/B test begins with a well-thought-out plan. Before diving into variations, it’s crucial to define what you’re testing, why it matters, and how you’ll measure success. This preparation ensures your test delivers actionable insights instead of wasting time and resources.
Set Clear Goals and KPIs
Your test should align with specific business objectives. Are you aiming to lower your cost per acquisition (CPA)? Boost onboarding completion rates? Increase average revenue per user (ARPU)? Different stages of your growth funnel demand different priorities and metrics.
For acquisition, focus on optimizing landing pages and signup flows. Track metrics like CPA, signup conversion rates, and traffic quality. If you’re targeting activation, aim to reduce the time to first value and improve onboarding completion by monitoring activation rates and feature adoption. For engagement and retention, keep an eye on daily active users (DAU), monthly active users (MAU), and session duration. When testing for monetization, measure ARPU, upgrade conversion rates, and expansion revenue.
It’s also important to track secondary metrics like scroll depth, time on page, and bounce rate. These help ensure that short-term wins don’t harm the overall user experience. For instance, a 15% increase in signups might seem great – until you notice it’s paired with a spike in bounce rate. That’s not a win; it’s a warning sign.
| Funnel Stage | Primary Focus | Key KPIs |
|---|---|---|
| Acquisition | Traffic & Signups | CPA, Signup Conversion Rate, Traffic Quality |
| Activation | Onboarding | Activation Rate, Time to Value, Feature Adoption |
| Engagement | Retention | DAU/MAU, Session Duration, Churn Rate |
| Monetization | Revenue | ARPU, Upgrade Conversion, Expansion Revenue |
These metrics not only guide your current test but also shape future experiments, helping you maintain steady growth.
Identify High-Impact Test Areas
Not all tests are created equal. While tweaking button colors might seem productive, it rarely drives meaningful results. Instead, focus on areas that directly influence your growth metrics.
For SaaS companies, activation (onboarding and first use) and monetization (upgrades and payment flows) often yield the highest returns. Pinpoint friction points where users hesitate or drop off – like requiring credit card details during trial signups, overly complicated onboarding processes, or pricing pages with unclear value propositions.
Use an impact/effort matrix to prioritize. Consider both the potential business value and the resources needed for implementation. For example, a headline test that could boost signups by 20% and takes two hours to set up is a better choice than a full page redesign requiring two weeks of development.
Landing page tests are particularly effective, with the potential to increase leads by up to 40%. Given that users form first impressions in just 0.05 seconds, layout and design elements deserve special attention. Remember to test one variable at a time for clear results. Multivariate testing, which changes multiple elements simultaneously, demands high traffic – typically over 50,000 monthly visitors – to yield reliable insights.
Create Your Hypothesis and Record Baseline Data
A strong hypothesis is the foundation of any test. Use this structure: "We believe that [change] will result in [outcome] because [reasoning]". This format forces you to think critically about the logic behind your test.
For example: "We believe adding customer logos to the landing page hero will boost signup conversion from 4.2% to 5.5% by reducing first-time visitor risk." This hypothesis clearly defines the change (adding logos), the expected outcome (higher conversion), and the rationale (social proof builds trust).
"A well-crafted hypothesis guides your test, ensuring you focus on the right changes and measure the correct outcomes." – Ptengine
Before launching, gather and document your baseline data. This serves as your benchmark for measuring success. For instance, if your current conversion rate is 4.2%, note that along with its stability over recent weeks.
Use a sample size calculator to confirm you have enough traffic for statistically valid results. To detect a 20% improvement on a 5% baseline conversion rate, you’ll need around 3,000 visitors per variant. Most tests require at least 1,000 actions per version to ensure reliability. Stick to standard A/B testing guidelines: 80% statistical power and a 95% significance level to minimize the risk of random results.
Centralize all this information – your hypothesis, baseline metrics, and success criteria – in a single repository. This documentation not only prevents redundant testing but also provides a valuable reference for future experiments.
With your plan and baseline data in place, you’re ready to design and execute your test variations.
Test Design and Setup Checklist
Once your planning is done, it’s time to build the test itself. This step is critical – it determines whether your results will be clear and actionable or muddled with noise. The key? Keep it simple. Change one thing, measure its impact, and avoid adding unnecessary variables.
Choose One Variable to Test
Testing multiple elements at once can ruin your results. For instance, if you tweak both the headline and the call-to-action (CTA) button, you won’t know which change caused the shift in performance. Stick to testing one variable at a time. This could be a headline, button color, pricing format, or image placement.
Focus on variables that matter most for your goals. For example:
- During the acquisition phase, test landing page headlines or value propositions.
- For activation, experiment with onboarding steps or feature introductions.
- For monetization, try variations in pricing displays or upgrade prompts.
Keep in mind, only 10–30% of experiments yield a clear winner. So, prioritize elements that have a real chance to make an impact. Also, make sure your variations are distinct enough to influence user behavior. Testing minor phrasing differences rarely works – try bold changes, like comparing "Start Your Free Trial" with "See How It Works".
Lastly, ensure the page has enough traffic to produce reliable data. At least 1,000 users should take action on each version for trustworthy results. Once you’ve picked your variable, create clear control and variation pages to isolate it.
Build Control and Test Variations
Your control (Version A) is the unchanged version of the page or element you’re testing. The challenger (Version B) is identical except for the single variable you’re modifying. Everything else – layout, navigation, branding, and surrounding content – must remain the same.
This consistency is essential. If you’re testing a headline, don’t also tweak the layout or swap images. Write down your hypothesis for clarity, such as: "Changing the CTA to ‘Start Free Trial’ will increase signups because it reduces perceived commitment." This helps you not only see what worked but also understand why it worked.
Before launching, test both versions across browsers and devices. Watch out for technical issues like the "flicker effect", where users briefly see the original content before the variation loads. This can skew results and invalidate your test. Use a 50/50 traffic split to ensure both versions get equal exposure, and double-check that your testing tool triggers variations only for users who see the changed element.
Once your versions are ready, move on to selecting the right testing tool and setting an appropriate test duration.
Select Your Testing Tool and Set Test Length
After building your variations, the next step is choosing the right tool and determining how long to run the test. Match your tool to your team’s needs with tailored consulting solutions. Marketing teams often prefer no-code visual editors for landing pages, while engineering teams may need developer-friendly SDKs and APIs for product features. Decide between:
- Client-side testing: Easier to set up, ideal for marketing pages.
- Server-side testing: More robust, better for testing product features.
Make sure your tool doesn’t slow down page load times, as this can skew results and harm SEO. It should also meet security standards, like SOC 2 certification and GDPR/CCPA compliance. Before running your first real experiment, conduct an A/A test (two identical versions) to confirm the tool is properly configured and doesn’t report false differences.
Set your test duration based on traffic and business cycles. Use a sample size calculator that factors in your baseline conversion rate and the minimum improvement you want to detect. For example, with a 5% baseline conversion rate, detecting a 20% improvement would require about 3,000 visitors per variation. Calculate the test length using this formula: Required Sample Size ÷ Average Weekly Visitors = Minimum Test Duration (in weeks).
Always run tests in full-week increments to account for daily traffic fluctuations. For email tests, you’ll usually see 85% of results within 24 hours. However, landing page tests often need at least 1–2 weeks. For B2B audiences, extend email test durations to 48–72 hours to account for slower response times. And never stop a test early just because one version seems to be winning – it increases the risk of false positives and unreliable conclusions.
Test Execution and Audience Segmentation Checklist
Once your test setup is ready, it’s time to ensure the live execution maintains the integrity of your experiment. After launching, keep a close eye on random allocation and subgroup responses to ensure reliable results. Random allocation – assigning users to control and variant groups without bias – ensures both groups are comparable, eliminating variables that could skew outcomes. Your testing tool should also block users from seeing multiple variations, which helps maintain the validity of your results. After this, it’s time to dive into audience segmentation for more detailed insights.
Segment Your Audience
Audience segmentation can uncover patterns that might otherwise go unnoticed. Focus on high-impact groups, like cart abandoners or first-time visitors, to tackle specific issues without exposing your entire audience to the experiment. Start with larger segments to reach statistical significance more quickly, and as traffic grows, refine your focus (e.g., "Mobile users in the US") for more precise insights.
To avoid interference between tests, use traffic bucketing. This means assigning distinct user groups to each test to prevent overlap. A centralized test calendar is also essential for identifying and avoiding potential conflicts between experiments. Once a test reaches statistical significance, break down results by factors like device type, location, or user behavior to understand variations in performance. These segmentation techniques are key to producing meaningful, actionable data.
Confirm Statistical Validity and Monitor Test Conditions
Don’t rush to declare a winner – stopping early can lead to misleading results, with up to 60% false positives. ExperimentHQ emphasizes:
"Early results are unreliable. A test showing +50% after 100 visitors often regresses to 0% after 1,000".
Ensure a balanced 50/50 traffic split between groups and confirm that both versions display correctly across all devices and browsers.
Keep an eye on guardrail metrics to make sure improvements in one area don’t harm other critical indicators. External factors like holidays, news events, or simultaneous campaigns should also be documented, as they can impact user behavior. Only declare a winner after reaching 95% confidence and achieving the required sample size – typically at least 1,000 conversions per version. Once these criteria are met, you can analyze the results to uncover actionable insights.
Data Collection and Analysis Checklist
Once your test is complete, the next step is turning raw data into meaningful insights. Start by tracking your primary metric – the single number that defines success, like conversion rate or revenue per visitor. Alongside it, keep an eye on secondary metrics such as click-through rate, scroll depth, or average session duration. These secondary metrics can help you understand how users are engaging with each variation. For instance, if your conversion rate improves but your bounce rate spikes, it’s worth digging deeper to uncover the cause.
Monitor Primary and Secondary Metrics
Real-time dashboards are invaluable for spotting issues and monitoring goal completions as they happen. In e-commerce, revenue per visitor (RPV) often provides a more complete picture than conversion rate alone. A variation might convert fewer visitors but generate higher average order values, leading to an overall revenue boost.
It’s also important to segment data by user type and device. This helps you identify how different groups respond to each variation. Rahul Gadekar from Stanford SEED & LISA emphasizes this point:
"Measuring the wrong metrics… can lead to misleading conclusions and missed opportunities".
By carefully tracking these metrics, you’ll lay a strong foundation for accurate analysis.
Assess Statistical Significance and Identify Patterns
Before declaring a winner, ensure your results meet a 95% confidence level (p-value ≤ 0.05) and that each version has at least 1,000 conversions. It’s worth noting that only 10%–30% of A/B tests produce a clear winner, while neutral results can be just as informative – they show what doesn’t resonate with users.
Pay close attention to the trade-offs between primary and secondary metrics. Also, consider the possibility of novelty effects, where initial excitement about a change fades over time. As Luke Sonnet from GrowthBook points out:
"Experimentation isn’t about proving you’re right. It’s about discovering what’s true".
Implementation and Next Steps Checklist
Now that you’ve gathered solid data, it’s time to put those insights to work. By building on your validated results, you can implement changes that set the stage for ongoing progress.
Roll Out Winning Variations
Start by deploying your winning variation to a small segment of your audience (1–10%) using feature flags. This limited rollout allows you to monitor performance and catch any technical issues or unexpected drops in results before scaling up. Once you confirm stable performance and consistent improvements, expand the rollout to 100%.
For major design updates, your development team should embed the new HTML, CSS, and assets directly into the core codebase, replacing the older version. Always have a "kill switch" in place so you can quickly roll back if something goes wrong. Once the new variation is fully implemented, it becomes your baseline for future experiments. For example, in 2025, River Island, a fashion retailer, used systematic email A/B testing to roll out winning variations. This resulted in a 30.9% increase in revenue per email and a 30.7% boost in orders per email, while also cutting send volume by 22.5%.
Document Results and Update Test Ideas
After deploying the winning variation, make it a habit to log every test in a centralized database. Include details like the hypothesis, design, results (including any secondary effects), insights gained, and the final decision. This step prevents duplicate testing and helps build a knowledge base for your team. To showcase the value of your testing program, calculate the estimated revenue gained or risks avoided over a six-month period.
Don’t overlook tests with neutral results – these can help refine future hypotheses. Record why a variation didn’t perform as expected to avoid repeating similar mistakes. Additionally, include a "suppositions" section in your test reports to capture ideas for applying successful concepts to other audience segments.
Schedule Your Next Test
Keep a 2–3 month backlog of experiments ready to ensure a steady flow of testing. Use tools like an Impact/Effort matrix to prioritize meaningful elements – such as headlines, value propositions, or pricing – over smaller tweaks like button colors.
Leverage insights from previous tests to build new hypotheses. For instance, if a benefit-driven headline performs well, try applying that approach to other pages or channels. Whisker, an automated pet care company, used this strategy by testing personalized messaging throughout its customer journey. The winning variation, implemented across multiple touchpoints, resulted in a 107% increase in conversion rates and a 112% boost in revenue per user. Aim for 8–12 tests per month per team member to maintain momentum.
Conclusion
A/B testing is all about patience and following a structured process. Businesses in their growth phase that conduct 50+ experiments annually see 47% higher revenue growth and 38% better customer retention compared to those running fewer than 10 tests. This isn’t just coincidence – it’s the outcome of relying on data-driven decisions rather than guesswork.
Using this checklist helps you replace instincts with measurable insights about your audience. On average, successful tests lead to improvements of 5% to 30%. When applied consistently across your customer journey, these incremental gains add up, creating a strong foundation for continuous improvement.
Even tests that don’t yield positive results are valuable – they show you what doesn’t work. Typically, companies identify just 1 winning test out of every 10. Keeping detailed records of every experiment ensures your team avoids repeating past missteps. Over time, this growing knowledge base sharpens your approach, making your future experiments even more effective.
FAQs
How do I pick the best KPI for my A/B test?
When selecting the best KPI for your A/B test, the first step is to define clear objectives that tie directly to your business goals. Your KPI should measure the specific outcome you want to influence – whether that’s conversion rate, user engagement, or revenue.
Steer clear of vanity metrics that look good on paper but don’t offer meaningful insights. Instead, focus on metrics that are measurable, reliable, and closely tied to user behavior. This approach ensures your test results deliver actionable insights that can drive real growth.
What if I don’t have enough traffic to A/B test?
If your website traffic is on the lower side, prioritize running small, high-intent tests to gain useful insights. These tests allow you to focus on actions that matter most to your audience. To make the most of these efforts, aim to optimize for higher conversion rates during the testing phase. Alternatively, you can combine results from multiple smaller tests to build a more comprehensive understanding over time.
Make sure to clearly define your hypotheses before starting any test. This will help you stay focused on your goals. Also, track the right metrics to ensure each test delivers actionable results, even with a smaller sample size.
How do I avoid false positives and bad winners?
To prevent misleading results and unfair conclusions in A/B testing, it’s crucial to tackle common pitfalls like the multiple testing problem, peeking, and poor statistical practices. Here’s how:
- Use correction techniques like the Bonferroni method or False Discovery Rate (FDR) to handle multiple comparisons effectively.
- Clearly define your hypotheses before running tests to avoid ambiguity.
- Ensure your sample sizes are large enough to provide meaningful results.
Also, resist the temptation to peek at results before the test is complete – it can skew outcomes. Stick to recommended test durations and maintain strict statistical guidelines to ensure your findings are accurate and trustworthy. Reliable testing requires discipline and careful planning.


0 Comments